Logging Summary
|
| IODP Expedition 344: |
|
Costa Rica Seismogenesis
Project, Program A Stage 2 (CRISP-A2)
Expedition 344
Scientific Party
|
| Introduction |
|
|
|
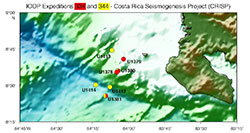
Figure 1.
Location map of CRISP program
sites, IODP Expedition 334.
|
Integrated Ocean Drilling Program
Expedition 344 (CRISP-A2) is the second
expedition in the Costa Rica
Seismogenesis Project, which started
with Expedition 334 (Figure 1).
The CRISP program was designed to
understand the processes that control
nucleation and rupture of large
earthquakes at an erosional convergent
margin. The Costa Rica location was
selected because of its relatively thin
sediment cover, fast convergence rate,
abundant seismicity, subduction erosion,
and change in subducting plate relief
along strike. CRISP drilling complements
other deep-fault drilling (San Andreas
Fault Observatory at Depth and Nankai
Trough Seismogenic Zone Experiment) and
investigates the first-order seismogenic
processes common to most faults and
those unique to erosional margins. The
primary goals of Expedition 344 were to
estimate the composition, texture, and
physical properties of the décollement
zone and upper plate material; to assess
the rates of sediment accumulation and
margin subsidence/uplift in slope
sediment; to evaluate fluid-rock
interaction, the hydrologic system, and
the geochemical processes in the upper
plate; to measure the stress field
across the updip limit of the
seismogenic zone; and to study the Cocos
Ridge subduction and evolution of the
Central American volcanic arc.
|
|
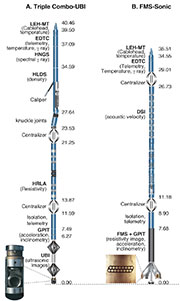
Figure 2. Wireline
logging tool strings used during
IODP Expedition 344.
|
The downhole logging program of
Expedition 344 was designed to
complement the core sample record by
measuring continuous, in situ profiles
of physical properties such as bulk
density, porosity, resistivity, and
natural gamma ray radiation. In addition
to these formation properties, downhole
logging provides oriented images of the
borehole wall useful to determine the
directions of bedding planes, fractures,
and borehole breakouts. As the
logging-while-drilling used in the
previous CRISP Expedition 334 was not
available due to budget constraints, in
Expedition 344 we conducted wireline
logging operations, where downhole
measurements are taken by tool strings
lowered in a previously drilled borehole
(Figure 2).
|
|
Logging
Operations
|
|
|
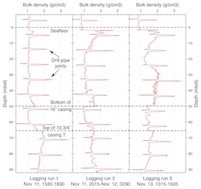
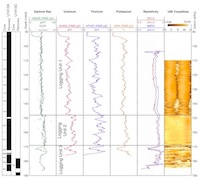
Figure 3.
Logging data showing the inferred
top depth of the 10¾ inch casing
string in Hole U1380C.
|
|
|
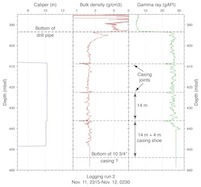
Figure
4. Logging data showing
the inferred base depth of the 10¾
inch casing string in Hole U1380C.
|
Wireline logging was attempted in Holes
U1380C, U1412B, and U1413C, drilled in
the upper plate of the Costa Rica
margin, and in Hole U1414A on the
subducting Cocos plate. Logging in the
upper plate sites proved challenging
because the holes were unstable after
drilling, making it difficult for the
tool string to enter the open hole
interval. Despite repeated attempts, we
were unable to exit the drill pipe and
log in the open hole at Holes U1380C
(middle slope) and U1412B (base of the
slope near the toe of the frontal
prism). Nonetheless, in Hole U1380C the
log data were useful to image the 10 3/4
inch casing string, whose final depth
was uncertain because the string fell
into the hole during deployment (Figures 3
and 4).
Hole U1413C was drilled in the upper
slope at 540 m water depth and is a
“pilot hole” for proposed deep riser
drilling. Hole U1413C was cored to 582
mbsf, and the first logging string
deployed was a slick Triple Combo that
measured borehole diameter, natural
gamma ray, and resistivity. Because of a
borehole obstruction, the tool string
could not descend below 187 mbsf, and we
logged an 84 m open hole interval to the
base of the drill pipe (104 mbsf). Two
more tool strings focused on imaging
borehole breakouts were successfully
deployed in this interval: a UBI tool
string (ultrasonic imaging) and a FMS
tool string (resistivity imaging; for
explanations of tool acronyms and tool
descriptions see http://iodp.ldeo.columbia.edu/TOOLS_LABS/tools.html).
Hole U1414A was located on the flank of
the subducting Cocos Ridge, ~1 km
seaward of the deformation front at 2469
m of water depth. The two logging
strings deployed in Hole U1414A, a
Triple Combo and a FMS-Sonic combination
(Figure 2),
could not reach the bottom 50 m of the
cored interval because of a borehole
obstruction. Logging data were
successfully collected in the interval
between 421 mbsf and the base of the
drill pipe (94 mbsf).
Logging
Results
Hole U1413C
|
|
Figure 5. Summary of
wireline log data acquired in
Hole U1413C.
|
A summary of the downhole logging
measurements collected in Hole U1413C is
in Figure 5.
Three logging units were defined on the
basis of the log data. Logging Unit 1
(93-148 mbsf) is characterized by total
gamma ray values of 38-46 gAPI, by a low
U content of 1.4-2.7 ppm, and by
relatively low resistivities just above
1 ohm.m. In this unit, the UBI images
display vertical bands with large
reflection traveltimes and one pair of
the caliper arms in the FMS tool
measures a large borehole diameter, up
to the maximum aperture of the arms (15
inches) In contrast, the borehole is
almost circular and nearly in gauge
through Logging Unit 2 (148-169 mbsf).
Compared to Unit 1, Unit 2 displays a
higher total gamma ray (~60 gAPI),
higher U content (about 3 ppm), and
higher resistivity. As the resistivity
of sedimentary formations is mostly
controlled by porosity, the increase in
resistivity implies a decrease in
porosity in Logging Unit 2. This
decrease in porosity and the circular,
in gauge borehole of Logging Unit 2
suggest a more consolidated formation
than in Unit 1. The borehole seems to be
washed out in all directions in Logging
Unit 3 (169-184 mbsf), and the low
values of natural radioactivity and
resistivity measured around 169 mbsf are
likely artifacts caused by a pronounced
borehole enlargement.
Hole U1414A
|
|
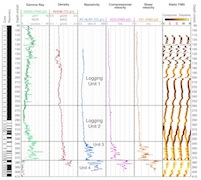
Figure 6.. Summary of
wireline log data acquired in
Hole U1414A.
|
A summary of the downhole logging
measurements collected in Hole U1414A is
in Figure 6.
We established four logging units in
Hole U1414A. Logging Unit 1 (94-259
mbsf) is characterized by low values of
total gamma ray, bulk density,
resistivity, and elastic wave velocities
that show a decreasing trend toward the
base of the unit, where the total gamma
ray value is ~10 gAPI, bulk density is
1.5 g/cm3, resistivity is 0.5 ohm.m, and
compressional and shear velocities are
1.6 km/s and 0.4 km/s, respectively. The
low and variable densities observed
above 185 mbsf are likely unreliable
because of an enlarged borehole. Logging
Unit 2 (259-335 mbsf) displays an
increase with depth of bulk density (1.6
to 1.8 g/cm3), resistivity
(0.5 to 1 ohm m), compressional velocity
(1.7 to 2.1 km/s), and shear velocity
(0.5 to 0.7 km/s). Natural gamma ray
values are generally 10-30 gAPI. Logging
Unit 3 (335-375 mbsf) contains larger
variations in physical properties, with
gamma ray values ranging between 20-60
gAPI, bulk densities 1.8-2.2 g/cm3,
resistivities 1-10 ohm m, compressional
velocities 2-4 km/s, and shear
velocities 0.5-2.7 km/s. Logging Units
1, 2, and 3 correspond to sediments that
become progressively more consolidated
with depth, and logging Unit 4 (375-410
mbsf) is the volcanic basement at Site
U1414. This basalt interval features
very low natural radioactivity (10 gAPI
or less) and high bulk density (2.3-2.8
g/cm3), resistivity (2-100
ohm m), compressional velocity (3.2-6.7
km/s), and shear velocity (1.7-3.8
km/s).
Scientific
Highlights
Borehole Breakouts in Hole
1413C
|
|
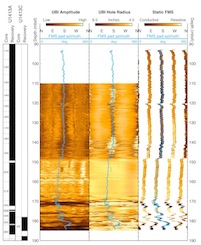
Figure 7.
Downhole log images obtained in
Hole U1413C.
|
Borehole breakouts are sub-vertical
hole enlargements that form on opposite
sides of the borehole by local failure
due to non-uniform horizontal stresses.
In a vertical borehole, the breakout
direction is parallel to the minimum
principal horizontal stress orientation
and perpendicular to the maximum
principal horizontal stress orientation.
Therefore, borehole breakouts are key
indicators of the state of stress in the
subsurface.
Clear evidence for breakouts was
collected in Hole U1413C by the UBI
ultrasonic tool and the FMS
microresistivity tool (Figure 7).
The UBI images show an irregular, large
radius borehole in Logging Unit 3 (below
169 mbsf) and a borehole that is smooth
and has a nearly constant radius in
Logging Unit 2 (148-169 mbsf). Within
Logging Unit 1 (above 148 mbsf), the
images show two nearly vertical bands of
high rugosity (low amplitude) and large
borehole radius (large traveltime).
These two bands are breakouts that
formed on opposite sides of the
borehole. The FMS images in Logging Unit
1 show low resistivity values (dark) in
the two pads that are in the same
direction as the high rugosity/large
traveltime bands in the UBI images. The
FMS caliper measurements in this
interval show that the pads measuring
low resistivities also measure the
larger borehole diameter. As the FMS
tool is pulled up, the 6 cm-wide
microresistivity pads get stuck in these
large-diameter borehole sectors, and the
measured low resistivity is likely
caused by the rough borehole surface
that prevents close contact with the
pad. The azimuth of the pair of pads
measuring the larger borehole diameter
is also plotted in Figure 7,
showing that the UBI and FMS
measurements of these large-diameter
borehole sectors are entirely
consistent. Notably, the approximately
N-S direction of the borehole breakouts
imaged in Hole U1413C is the same as
that detected by logging-while-drilling
in Hole U1379A, which was drilled in a
similar upper slope setting during
Expedition 334.
Borehole Breakouts in Hole
U1414A
|
|
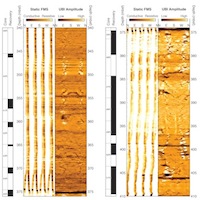
Figure
8. Downhole log images
obtained in Hole U1414A.
|
Borehole images of FMS microresistivity
and UBI reflection amplitudes (related
to the small-scale roughness of the
borehole wall) from Hole U1414A are
in Figure 8.
The images in Figure
8 span the lowermost interval
logged in Hole U1414A, containing the
consolidated sediments in Logging Unit 3
and the basalt of Logging Unit 4. In the
sediment interval (340-375 mbsf) the FMS
and UBI show a sedimentary formation
with generally horizontal layers, except
for an interval between 360 and 370 mbsf
where there is evidence of a westward
dip. The UBI image also shows vertical
fractures oriented ESE-WNW, which could
be drilling-induced tensile fractures
The top of a steep fracture intersecting
the borehole is also visible at 354-355
mbsf. The base of the sediment column at
~375 mbsf is marked by a thin (<0.5
m) borehole enlargement, which was also
measured by the caliper logs. In the
basalt (375-410 mbsf), the image logs
show a complex set of fractures.
Intervals of higher resistivity and
reflection amplitudes (e.g., at 375-380
and 385-396 mbsf) correspond with
intervals of higher core recovery,
suggesting a more competent formation.
Summary
While downhole log data acquisition was
challenging in the upper plate sites of
Expedition 344 because of collapsing
boreholes, wireline logging measured
profiles of gamma-ray radioactivity,
density, sonic velocity, and electrical
resistivity together with ultrasonic and
resistivity images of the borehole wall
in Holes U1413C (upper slope) and U1414A
(Cocos Ridge flank). The borehole images
in Hole U1413C show clear evidence of
borehole breakouts, which form when
there are differences in the principal
horizontal stresses. These images
provide key data to estimate the state
of stress in the upper plate, one of the
major objectives of the CRISP program.
Log data and borehole images collected
in the lower part of Hole U1414A will
complement core observations in
intervals of incomplete recovery.
|
Alberto Malinverno:
Logging Staff Scientist, Borehole
Research Group Lamont-Doherty Earth
Observatory of Columbia University, PO
Box 1000, 61 Route 9W, Palisades, NY
10964, USA
Saneatsu Saito:
Logging Scientist, Institute for
Frontier Research on Earth Evolution
(IFREE), Japan Agency for Marine-Earth
Science and Technology (JAMSTEC), 2-15
Natsushima-cho, Yokosuka 237-0061 Japan
|
|
|