IODP
Expedition 336: Mid-Atlantic Ridge Microbiology |
Figure
6 |
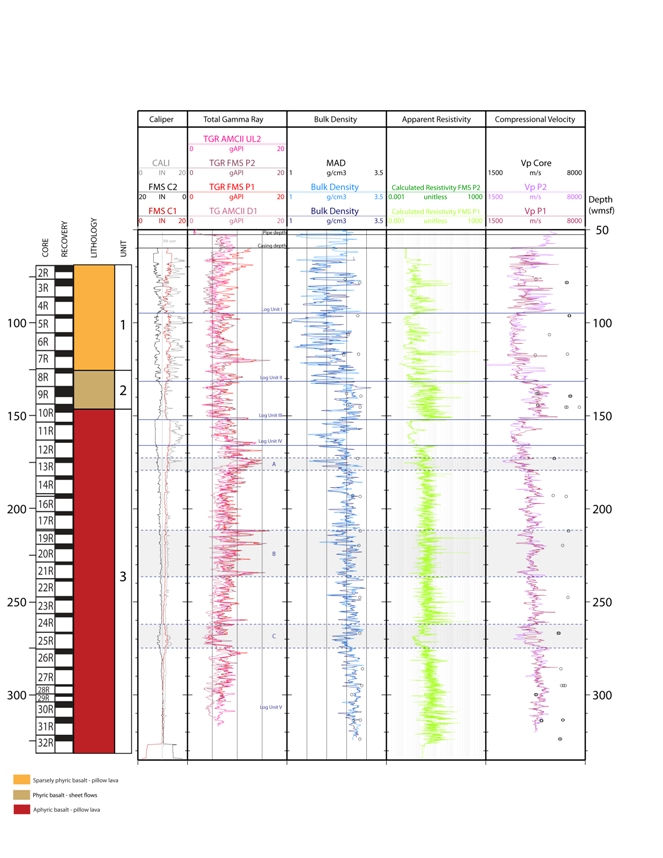
Summary of Hole U1383C logging results. Blue lines = log unit divisions, black lines = limits of pipe and casing. Measurements include borehole diameter (FMS C1, C2 = FMS Pass 1; CALI = AMC II Uplog 1), total gamma ray (TGR; AMCII UL2 = from AMC II Uplog 2; FMS P1, P2 = from FMS-sonic Pass 1, Pass 2; AMCII D1 = from AMC II Downlog 1), density (bulk density = from AMC II Uplogs 1 and 2; MAD = moisture and density testing on discrete core samples), apparent resistivity (calculated resistivity FMS P2, FMS P1 = from FMS pad average from Pass 1, Pass 2), compressional velocity (VP core = from discrete core cube samples; VP P1, P2 = from FMS-sonic Pass 1, Pass 2). A summary of core recovery and lithologic units is provided at the far left, and on the far right is electrical stratigraphy based on FMS electrical images. |