|
|
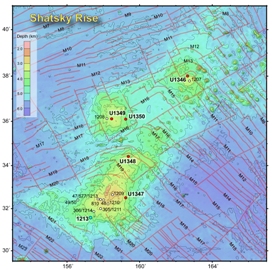
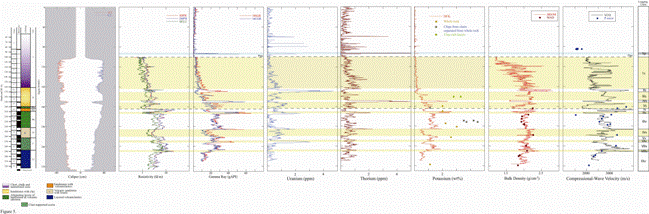
| Figure 2. Downhole
logging data obtained from Site
U1346: Shirshov Massif. |
Site U1346:
Shirsov Massif
Site U1346 was situated at the north
edge of the Shirshov Massif summit in
northern Shatsky Rise (Figure 1),
where acoustic basement is nearly
flat, implying a subaerially eroded
summit platform (Sager et al., 1999).
A single hole was drilled (Hole
U1346A), penetrating 191.8 m below the
seafloor, with 139.2 m of sedimentary
cover and 52.6 m of igneous rock.
Downhole logging data obtained from
Hole U1346A included natural and
spectral gamma ray, density,
photoelectric factor (PEF), and
electrical resistivity measurements from
three depths of investigation (Figure 2).
Interpretations of gamma ray and
electrical resistivity downhole logs
were used to identify 14 logging units
in Hole U1346A with three in the section
covered by the bottom-hole assembly
(BHA), four in the sedimentary sequences
in the open hole interval, and seven in
the basaltic basement. The sedimentary
sequence shows several prominent gamma
ray anomalies associated with uranium
enrichment. The most prominent anomaly
is found at the sediment/basement
interface and may be indicative of
focused hydrothermal fluid flow.
Shallower anomalies recorded through the
BHA may represent oceanic anoxic events
(OAE's) previously interpreted in this
area. Electrical resistivity
measurements in the basaltic basement
show four distinctive massive zones
characterized by higher resistivity
values, which may represent individual
thick lava flows. Relatively high
potassium content in the basement
section also suggests a high degree of
hydrothermal alteration.
|
|
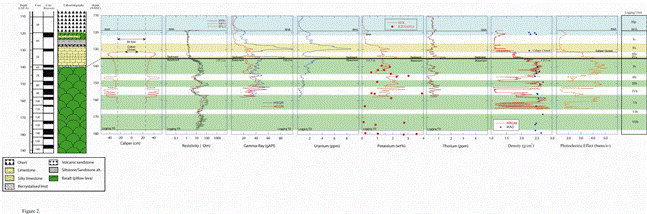
Figure 3.
Downhole logging data obtained
from Site U1347: TAMU Massif.
|
|
|
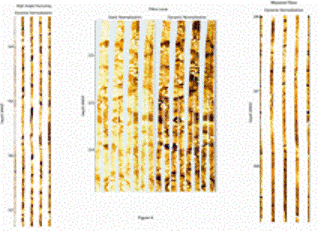
Figure 4. Formation
MicroScanner (FMS) images from
Site U1347.
|
Site U1347: TAMU
Massif
Site U1347 was situated on the upper
flank, east of the summit of TAMU Massif
on southern Shatsky Rise (Figure 1).
The site location was chosen at a spot
where sediments are thin and the
"layered basement" signature seen
elsewhere on southern Tamu Massif was
also thin. Drilling in a single hole
(U1347A) penetrated 317.5 m below the
seafloor, including a 157.6 m
sedimentary section and a 159.9 m
igneous section.
Downhole logging data obtained from
Hole U1347A included natural and
spectral gamma ray, density, neutron
porosity, photoelectric factor, and
electrical resistivity measurements from
three depths of investigation (Figure 3)
Formation MicroScanner (FMS) images
show zones of distinctive pillow lavas,
zones with high fracture density, and
intervals that seem to represent massive
lava flows (Figure
4).
|
|
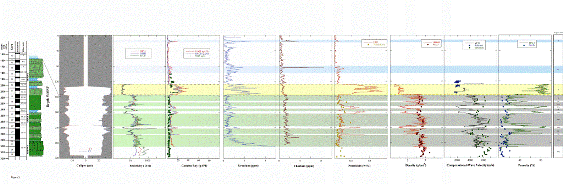
Figure 5. Downhole
logging data obtained from Hole
U1348A.
|
|
|
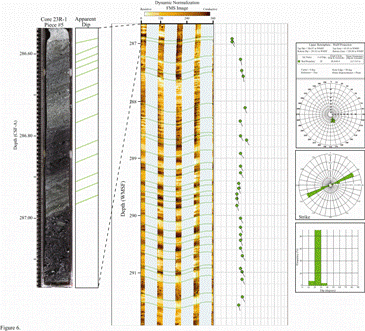
Figure 6. Formation
MicroScanner (FMS) images for Hole
U1348.
|
Site U1348: TAMU
Massif
Site U1348 was located on the north
flank of TAMU Massif (Figure 1).
The drilling target was the upper part
of a basement high where sediments are
thin. A single hole (U1348A) was drilled
at the site, with 324.1 m of penetration
below the seafloor that included a thick
sequence (~120 m stratigraphically) of
volcaniclastic sediments underlying
shallow water calcareous sandstones,
greenish clays, nannofossil ooze, and
chert.
Downhole logging data obtained from
Hole U1348A included natural and
spectral gamma ray, density,
photoelectric factor, compressional-wave
velocity, and electrical resistivity
measurements from three depths of
investigation (Figure
5).
Interpretations of gamma ray and
electrical resistivity downhole logs
were used to identify a total of 15
logging units in Hole U1348A with one in
the section covered by the BHA, five in
the sedimentary sequences in the open
hole interval, and nine in the
volcaniclastic section. Electrical
resistivity measurements show
distinctive higher resistivity zones
that likely represent less altered
intervals, interspersed with low
resistivity zones that mark sediment
interbeds and more altered sequences.
Natural gamma-ray measurements show
several intervals of higher readings
that indicate interbedded sediments and
higher alteration. These intervals also
display higher potassium, uranium, and
thorium values.
Formation MicroScanner (FMS) images
show zones with distinct horizontal
layering, dipping beds, and vesicular or
brecciated intervals. Preliminary
structural analyses of dipping beds show
features striking northeast–southwest
and dipping mostly 20-30° to the
southeast (Figure
6).
Site U1349: Ori
Massif
|
|
Figure 7. Downhole
logging data obtained from Hole
U1349.
|
|
|
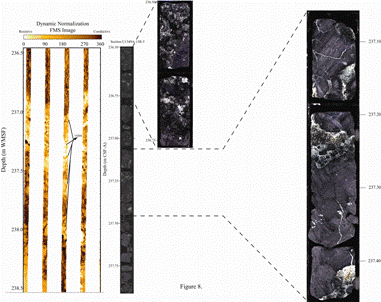
Figure 8.
Formation MicroScanner (FMS)
images from Hole U1349.
|
Site U1349 was located at the summit of
ORI Massif (Figure
1) on a flat-topped basement ridge
that seems to have been shaped by sea
level erosion. Hole U1349A was the only
hole drilled at the site. It penetrated
250.4 m beneath the seafloor, through
165.1 m of sediment and 85.3 m of
igneous basement.
Downhole logging data obtained from
Hole U1349A included natural and
spectral gamma ray, density, and
electrical resistivity measurements from
three depths of investigation (Figure 7).
Interpretations of gamma ray and
electrical resistivity downhole logs
were used to identify a total of 19
logging units in Hole U1349A with one in
the section covered by the BHA, five in
the sedimentary sequences in the open
hole interval, and thirteen in the
basaltic basement section. Electrical
resistivity measurements show
distinctive higher resistivity zones
that likely represent less altered
intervals, interspersed with low
resistivity zones that mark more altered
sequences. Natural gamma-ray
measurements show a large peak just
below the sediment-basement interface
that may indicate a zone of concentrated
hydrothermal alteration. This interval
also displays very high uranium values
and a smaller peak in potassium values.
Formation MicroScanner (FMS) images
show zones with highly fractured
intervals, potential veins, and
vesicular or brecciated intervals (Figure 8).
|
|
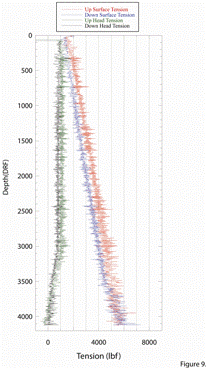
Figure 9.
Downhole logging data obtained
from Hole U1350.
|
|
|
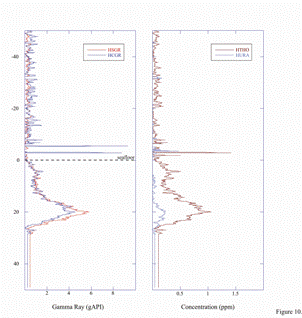
Figure
10. Gamma ray
measurements from Hole U1350.
|
Site U1350: Ori
Massif
Logging operations in Hole U1350A
consisted of two attempts to deploy one
tool string and took place in
deteriorating weather with initial ship
heave conditions of ~ 2 m, which
gradually changed to ~ 4 m peak-to-peak
heave and wind gusts of up to 56 knots.
Deteriorating weather conditions, time
constraints, large fluctuations in
surface tension, and a failure of the
head tension sensor (Figure 9)
contributed to aborting logging
operations in this site.
The down log inside the BHA recorded
approximately 27.7 meters of the shallow
sediments (Figure
10).
The gamma ray measurements in the
shallow sediments show an anomaly from
seafloor to approximately 25 m WMSF. The
contributions to this anomaly are mainly
an increase in thorium and a smaller
contribution from uranium.